La Quinta · Benahavis · Under construction
La Quinta Heights
- €2.45m
- From
- 4–5
- Bedrooms
- 12
- Residences
- 7
- Available
- Q4 2027
- Completion
As published by the developer2
This is a fictional demonstration project. Its name, prices, dates and unit counts are invented to show how a Development is presented here; it is not an offer for sale.
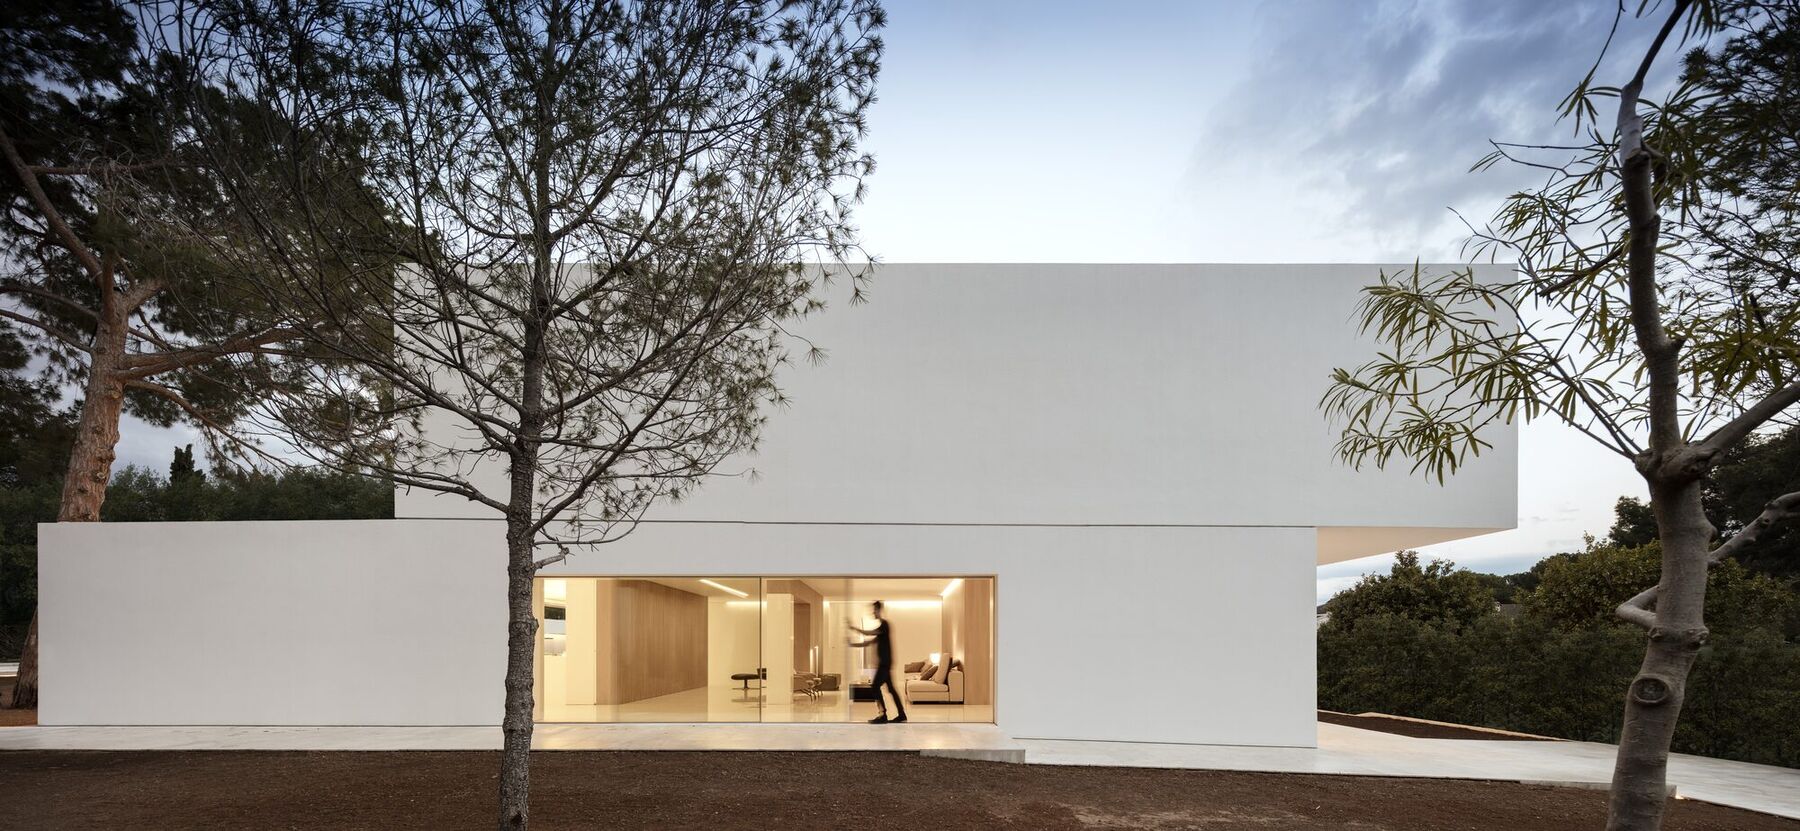
La Quinta Heights is a fictional demonstration project. It stands in for the kind of hillside villa collection this coast builds: a dozen homes on individual plots, long single-storey living floors opening onto covered terraces, and a pool set into the slope so the water reads against the horizon.
Each villa is arranged around a central courtyard, with bedrooms on the upper level and a lower garden floor that can be finished as a gym, cinema or independent apartment. Finishes are specified rather than chosen from a catalogue; the developer’s brochure would list them.
Amenities
- Private infinity pool
- Covered outdoor kitchen
- Lower garden floor
- Underfloor heating and cooling
- Home automation
- Two-car garage
- Gated entrance
- Golf and sea views

Location
La Quinta, Benahavis, Andalusia
About Benahavis
Live inventory, the areas within Benahavis, and what different budgets buy there. Read the Benahavis guide
Payment terms2
- 2%Reservation
- 28%Private purchase contract
- 20%Roof completion
- 50%Completion
Project team
- Developer
- Demo Developer S.L. (fictional)
Investor view
Market position
Market context
2 Demo data — illustrative, fictional3 Meklara calculation4 Demo data — illustrative, fictional5 Demo data — illustrative, fictional6 Demo data — illustrative, fictional7 Demo data — illustrative, fictional
Things to weigh
- Rental evidence for new-build stock in this area is limited; any yield shown is a scenario, not an observation.
- Commercial figures are source-supported but have not been independently verified by a person.
No overall score or rating is shown. Figures are facts as published, calculations with their method stated, or clearly labelled demo data — see Sources & methodology.
Ask about La Quinta Heights
Request the brochure and current availability
Figures marked “Demo data” are illustrative and fictional. They demonstrate how this site will present market evidence and are not actual market research.
Source information
- 01
Demo presentation imagery · Wikimedia Commons contributors
Licensed photographs chosen to illustrate this demonstration website: the coast, its towns, and the fictional demo Developments. They are not photographs of any real Development or home listed here, and a real record’s own images are never taken from this set.
- A minimal white house between pines (Fran Silvestre Arquitectos) — Fernando Guerra FG+SG, CC BY-SA 4.0 source
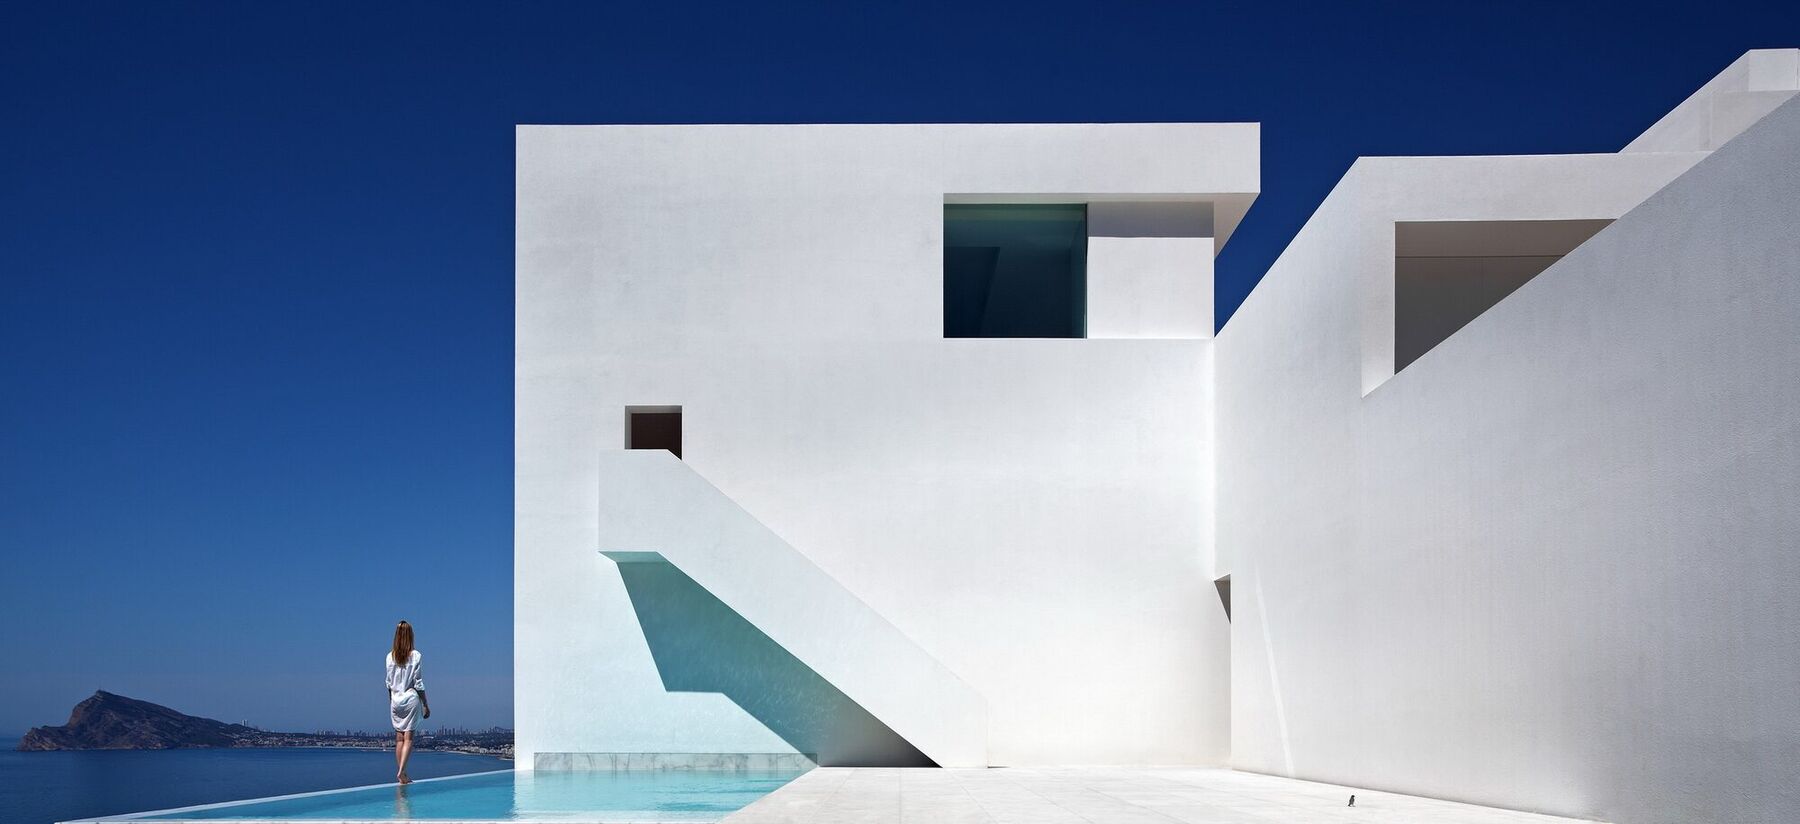
- A white house on the cliff (Fran Silvestre Arquitectos) — Pcambal, CC BY-SA 3.0 source
- A ribbed white facade — Luca Bravo lucabravo, CC0 source
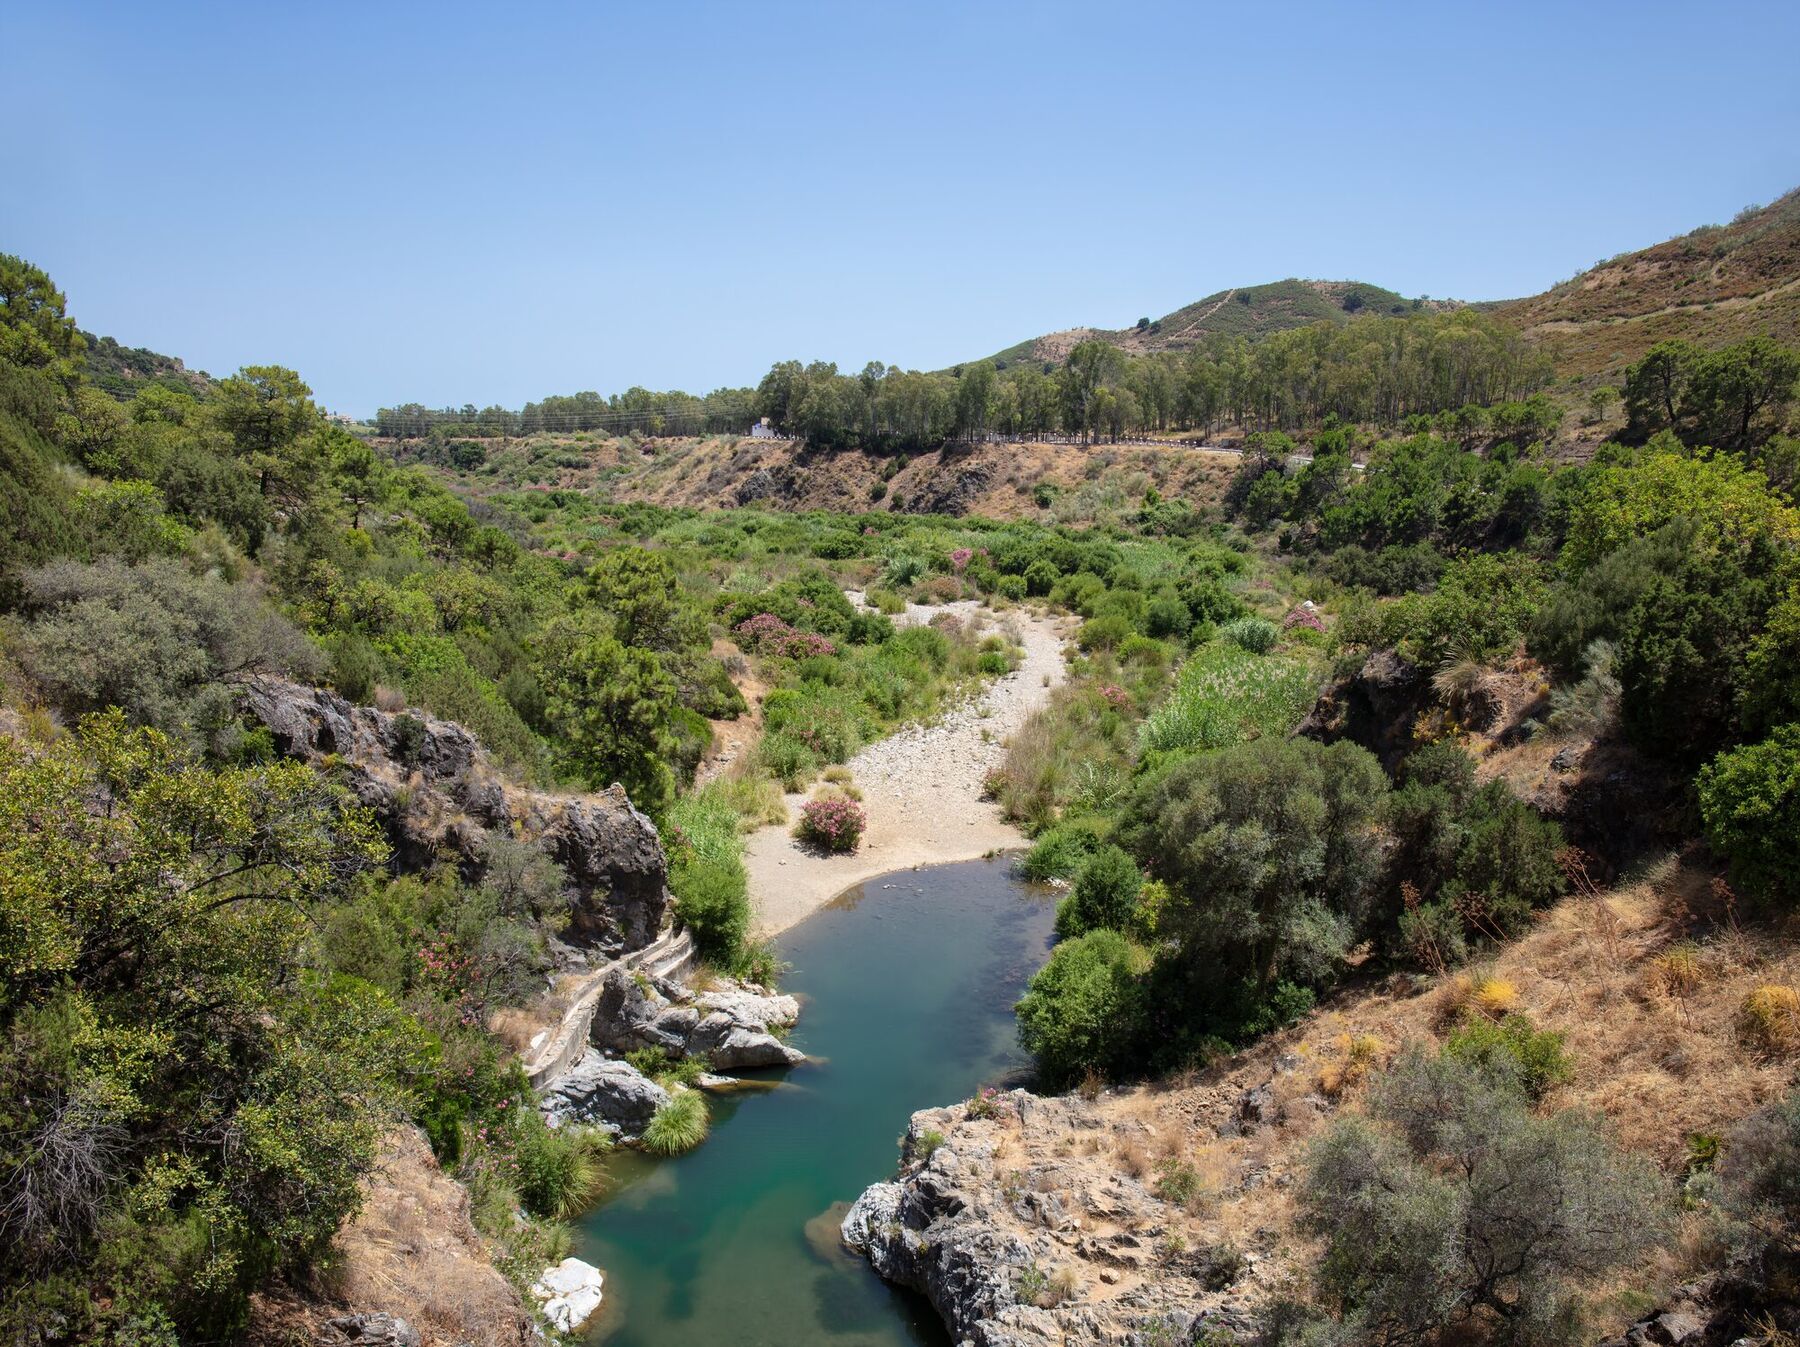
- A river gorge in the hills behind Marbella — Werner Wilmes, CC BY 2.0 source
- 02
Demo Development fixture — La Quinta Heights · Demo Developer S.L. (fictional) Demonstration data
A fictional project seeded to demonstrate this website’s Development presentation. Its name, prices, unit counts, dates and terms are invented; only the place names are real. Illustrative fictional data for demonstration purposes. Not actual market evidence.
- 03
Meklara calculation — indicative price per m² · Meklara
Lowest published price ÷ largest published interior area, to highest published price ÷ smallest published interior area. A deliberately wide indicative range: the publication gives ranges, not per-residence figures.
- 04
Demo market dataset — comparable €/m² · Meklara demo Demonstration data
Fictional median asking €/m² standing in for a calculation across currently published new-build units in a Development’s own area. Illustrative fictional data for demonstration purposes. Not actual market evidence.
- 05
Demo market dataset — gross yield scenario · Meklara demo Demonstration data
Fictional scenario: annual rent ÷ purchase price, before costs, taxes, vacancy and management. Neither the rent nor the price is a real observation. Illustrative fictional data for demonstration purposes. Not actual market evidence.
- 06
Demo market dataset — new-build price movement · Meklara demo Demonstration data
Fictional figure representing the kind of period-over-period asking-price change a market pipeline would calculate from published new-build prices. Illustrative fictional data for demonstration purposes. Not actual market evidence.
- 07
Demo market dataset — competing supply · Meklara demo Demonstration data
Fictional count standing in for active developments within a Development’s own area and price band. Illustrative fictional data for demonstration purposes. Not actual market evidence.
.jpg)

.jpg)
