Costa del Sol market update

What is currently published, and how this site will report market movement once real evidence is in place.

Costa del Sol market update

A market update on this site is a set of sourced figures with a stated method, and a short interpretation of them. This first edition shows the format with live counts and clearly labelled demo figures.
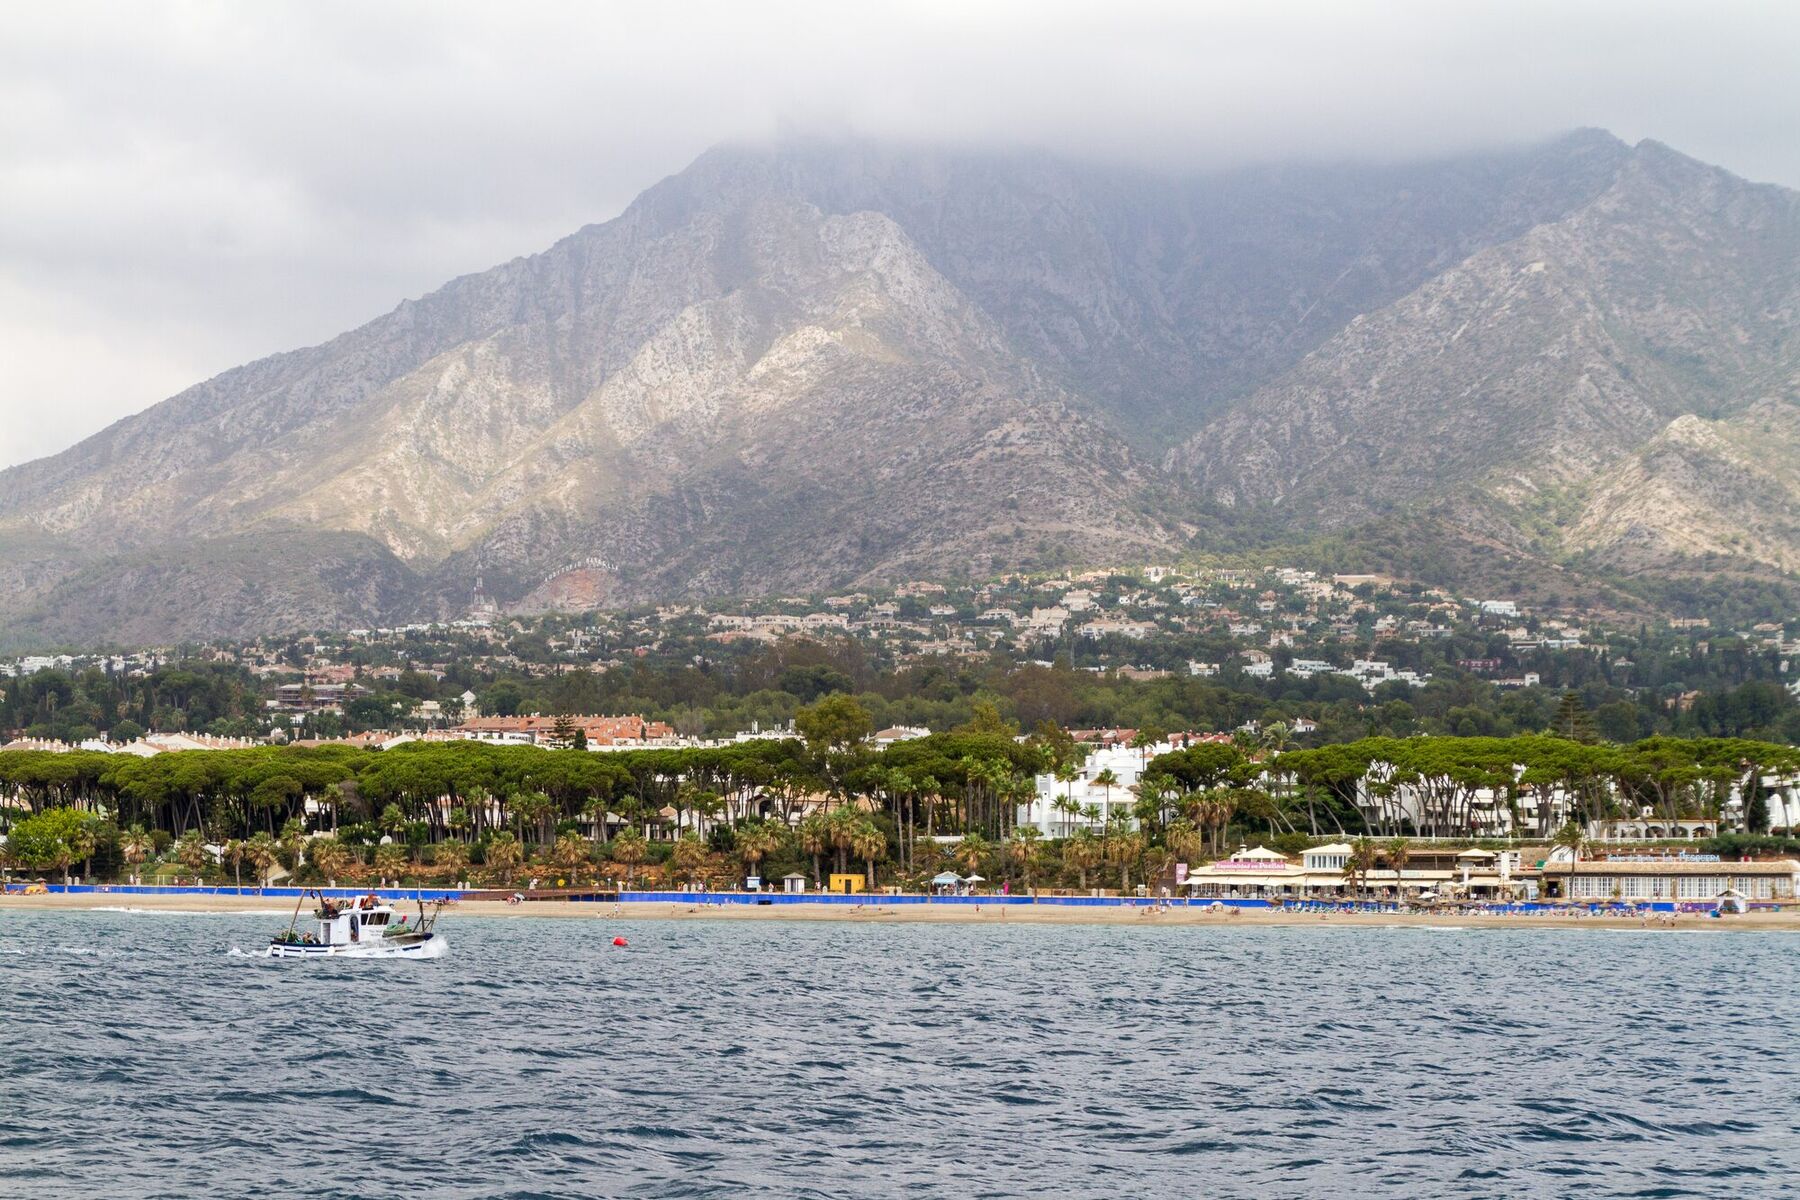
La Concha above the Marbella shore

Market update

September 2026

What is published right now.

+12%2Illustrative new-build asking price movement, 2023–2025
5.8%3Illustrative gross rental yield scenario
44Active developments published
€220k4Lowest new-build entry price

The live figures are counted from the inventory synchronized to this website. The figures marked Demo data are fictional placeholders that show where calculated market metrics will appear once the evidence pipeline is in place.

2 Demo data — illustrative, fictional3 Demo data — illustrative, fictional4 Live Meklara inventory

How future editions will be produced

A scheduled run will gather current Development and inventory facts from Meklara, refresh approved external evidence, calculate the metrics with their method recorded, compare them with the prior period and draft a commentary from that evidence. A person reviews and approves before anything is published here. If nothing material has changed, no update is issued.

Figures marked “Demo data” are illustrative and fictional. They demonstrate how this site will present market evidence and are not actual market research.

Source information
  1. 01

    Demo presentation imagery · Wikimedia Commons contributors

    Licensed photographs chosen to illustrate this demonstration website: the coast, its towns, and the fictional demo Developments. They are not photographs of any real Development or home listed here, and a real record’s own images are never taken from this set.

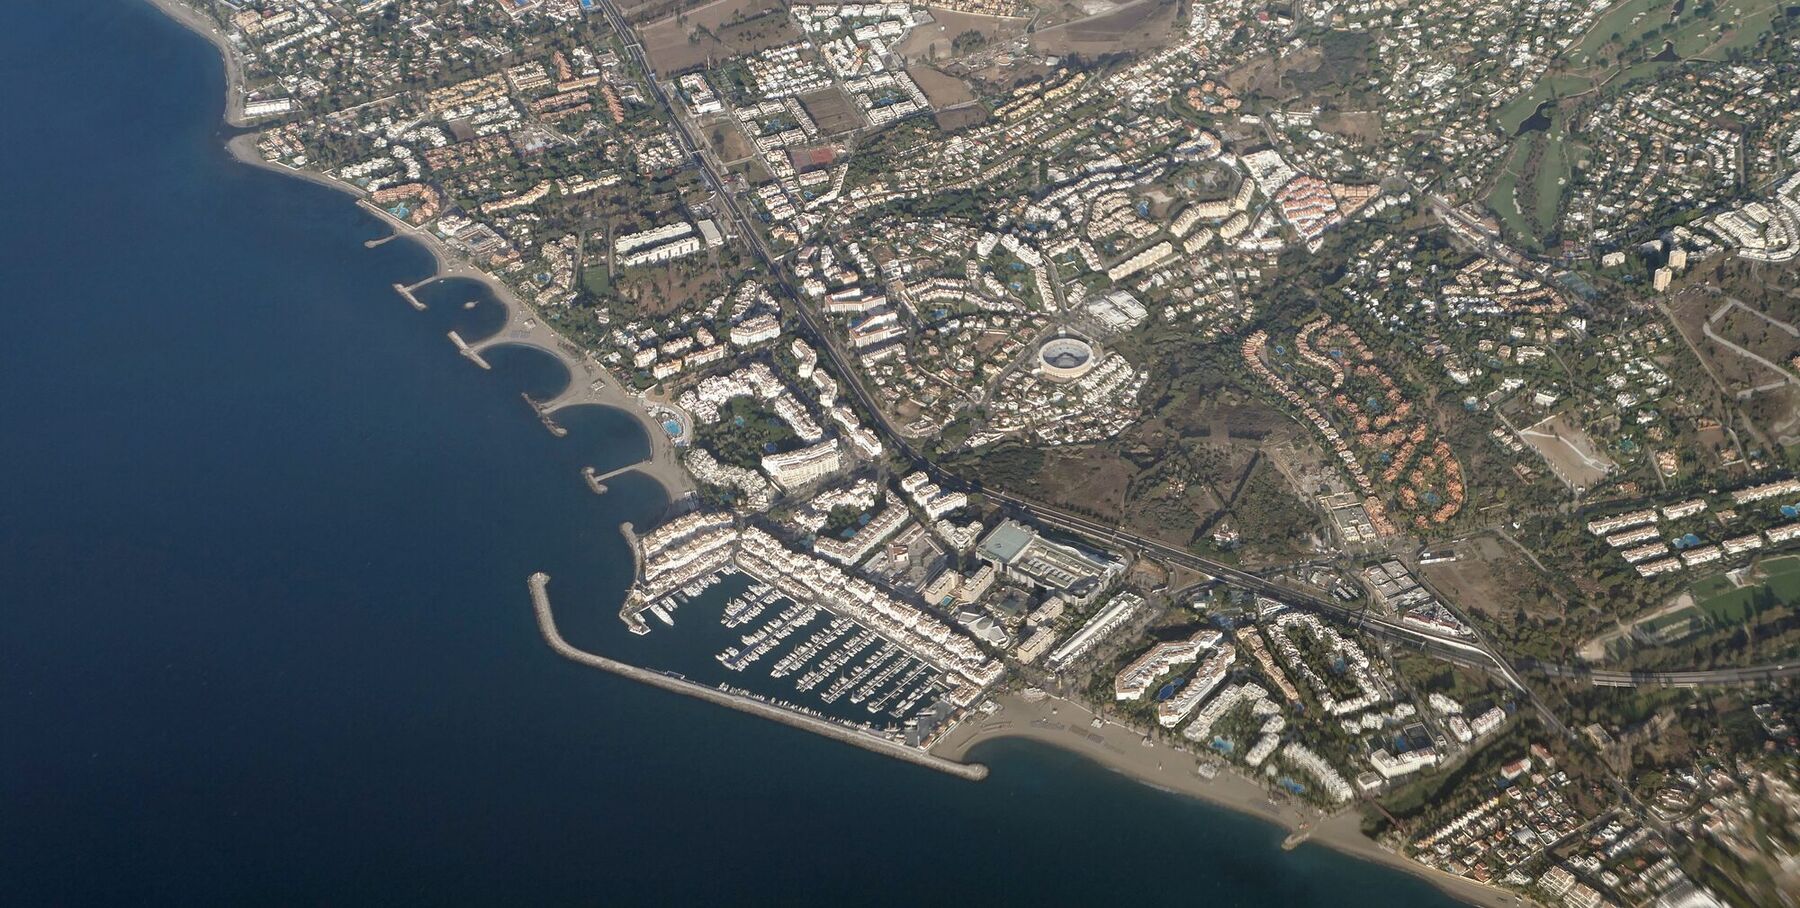
    • Puerto Banús and the Golden Mile from the air — Adam Cli, CC BY-SA 4.0 source
    • La Concha above the Marbella shore — TimOve from Norway, CC BY 2.0 source
  2. 02

    Demo market dataset — new-build price movement · Meklara demo Demonstration data

    Costa del Sol (illustrative)

    Fictional figure representing the kind of period-over-period asking-price change a market pipeline would calculate from published new-build prices. Illustrative fictional data for demonstration purposes. Not actual market evidence.

  3. 03

    Demo market dataset — gross yield scenario · Meklara demo Demonstration data

    Selected Costa del Sol areas (illustrative)

    Fictional scenario: annual rent ÷ purchase price, before costs, taxes, vacancy and management. Neither the rent nor the price is a real observation. Illustrative fictional data for demonstration purposes. Not actual market evidence.

  4. 04

    Meklara live inventory · Mas Property via Meklara

    · All published locations · May be out of date

    Counted from the published Development and Property records synchronized to this website. Developments marked sold out, withdrawn or paused are excluded.


Keep reading

More from Mas Property

Figures marked “Demo data” are illustrative and fictional. They demonstrate how this site will present market evidence and are not actual market research.

Source information
  1. 01

    Demo presentation imagery · Wikimedia Commons contributors

    Licensed photographs chosen to illustrate this demonstration website: the coast, its towns, and the fictional demo Developments. They are not photographs of any real Development or home listed here, and a real record’s own images are never taken from this set.

    • Puerto Banús and the Golden Mile from the air — Adam Cli, CC BY-SA 4.0 source
    • La Concha above the Marbella shore — TimOve from Norway, CC BY 2.0 source
    • Bougainvillea on a Marbella facade — Jeff Hitchcock, CC BY 2.0 source
    • Puerto Banús at dusk — TimOve from Norway, CC BY 2.0 source
  2. 02

    Demo market dataset — new-build price movement · Meklara demo Demonstration data

    Costa del Sol (illustrative)

    Fictional figure representing the kind of period-over-period asking-price change a market pipeline would calculate from published new-build prices. Illustrative fictional data for demonstration purposes. Not actual market evidence.

  3. 03

    Demo market dataset — gross yield scenario · Meklara demo Demonstration data

    Selected Costa del Sol areas (illustrative)

    Fictional scenario: annual rent ÷ purchase price, before costs, taxes, vacancy and management. Neither the rent nor the price is a real observation. Illustrative fictional data for demonstration purposes. Not actual market evidence.

  4. 04

    Meklara live inventory · Mas Property via Meklara

    · All published locations · May be out of date

    Counted from the published Development and Property records synchronized to this website. Developments marked sold out, withdrawn or paused are excluded.